General Information –
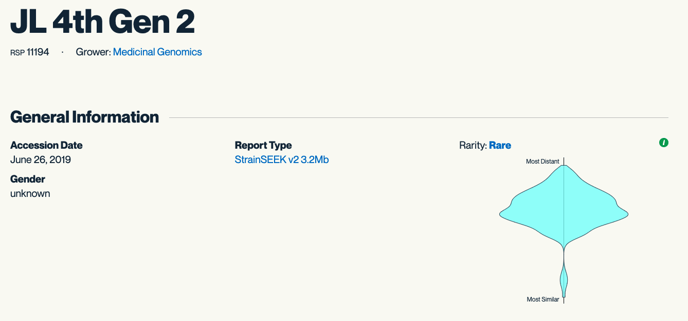
Strain: Name of the strain provided by the customer
RSP: The number we assign as the strains are added to our repository
Grower: Name of the customer
Accession Date: Date the strain was submitted to Kannapedia
Gender: The gender provided by the customer: Male, Female, or Unknown
Report Type: We are constantly doing bioinformatics work to find new areas of interest in the genome. As more and more areas of the genome are correlated to beneficial phenotypes, Medicinal Genomics will continue to update the StrainSEEK® panels. We are currently on StrainSEEK® V3. We also offer Whole Genome Sequencing and the CannSNP90 Array.
Strain Rarity Graph (Violin Graph):
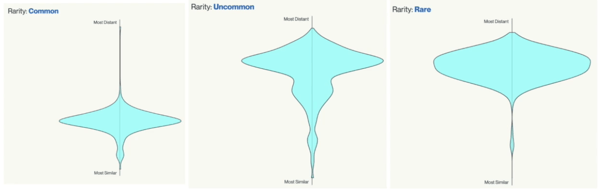
The strain rarity visualization shows how distant the strain is from the other cultivars in the Kannapedia database. The y-axis represents genetic distance, getting farther as you go up. The width of the visualization at any position along the y-axis shows how many strains there are in the database at that genetic distance. So, a common strain will have a more bottom-heavy shape like a pair, while uncommon and rare cultivars will have a visualization that is generally shifted towards the top.
Chemical Information
We always ask that people supply us with this information. We do not do metabolite analysis in house, so we ask that the customer provides that information.
Genetic Information
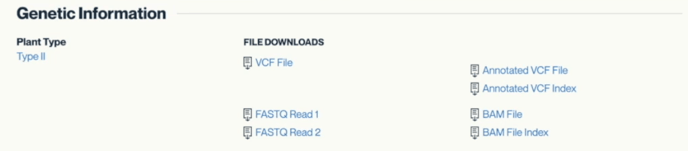
Plant Type
Plant type classifies the cannabis plant depending on the type of cannabinoid and the concentration produced. It is tied into the Bt/Bd allele coverage. So far, we have identified four main types:
- Type I: THCA dominant plants, produce mainly THCA.
- Type II: THCA/CBDA hybrids, can produce a 1:1 THCA: CBDA chemical profile.
- Type III: CBDA dominant plants, very little THCA production.
- Type IV: CBGA dominant plant, produces little to no THCA and CBDA.
File Downloads
Each Kannapedia report includes several files that are available for download that represent the results of the sequencing that was performed on the sample to generate the report.
- Variant Call Format (VCF) files are an industry standard file format representing genetic differences between your sample and the Jamaican Lion Mother reference genome sequence NGS reads are aligned to. VCF files contains a header with all the metadata related to the strain, then a list of variant calls and the locations they fall in the genome. VCF files are compressed and are not designed to be human readable, but when uncompressed they are presented in plain text and can be viewed. However, they are best manipulated with command line utilities such as tabix and bcftools. Along with the variant calls and locations in the genome there is lots of additional information such as the sequencing depth of each variant. The sequencing depth indicates how many times a particular variant is observed in the data; variants called by multiple high quality NGS reads aligned to a reference genome are more likely to be real variants.
- FASTQ files are the raw data reads from the sequencing run. These reads are aligned and compared to the Jamaican Lion reference genome.
- BAM files contain the mapped positions of the sequencing reads to the Jamaican Lion Mother reference.
Heterozygosity
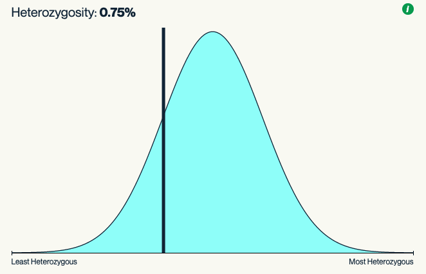
This plot shows the heterozygosity distribution for all samples in Kannapedia, and the line shows where the current sample falls on this distribution. Breeders can use this heterozygosity information as a proxy for assessing seed line stability; a more stable seed line will have a lower heterozygosity percentage and will fall to the left of this distribution curve.
Bt/Bd Allele Coverage (StrainSEEK® or WGS)
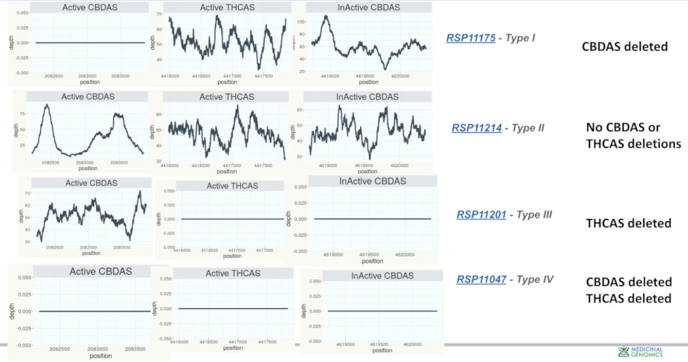
The next section of the Kannapedia report has next-generation sequencing coverage over key cannabinoid genes. The patterns of deletions in these genes indicate the plant type. Note: Inactive CBD synthase is in close proximity to the Active THC synthase. Because of its proximity, we track it to give a sense of the size of the deletion.
- In Type I plants, the Active CBD synthase gene is deleted. And there's no next-generation sequencing coverage over the region.
- In Type II plants, Active CBD synthase and Active THC synthase are both intact.
- In Type III plants, Active CBD synthase has coverage over the region showing that the gene is intact. But Active THC synthesis has no coverage over the region, suggesting that it's deleted.
- In Type IV plants there is neither coverage over Active CBD synthase or Active THC synthase.
CBCAS Coverage
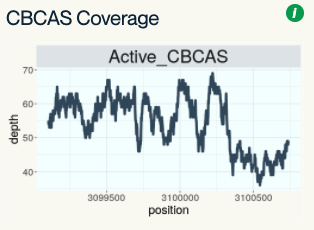
The report also shows coverage over the Cannabichromene synthase gene. One interesting feature of Cannabichromene synthase is that it may be responsible for synthesizing THC in cases where the THC synthase gene is deleted.
Cannabinoid Synthase Coverage (CannSNP90)
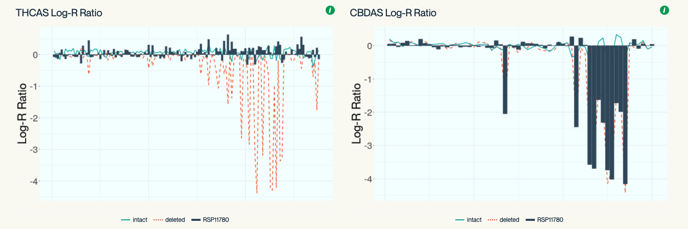
CannSNP90-derived Kannapedia reports present cannabinoid synthase gene coverage in a different way. A Log-R Ratio for all variants in a particular genomic region in the test sample is calculated and compared to an average Log-R Ratio of samples with known deletions in this region as well as samples with known intact genes. A correlation score is calculated between the test sample and the population of samples with a known deletion. Low correlation indicates the gene is intact and high correlation suggests the gene is deleted. The plot on the left shows a sample likely to have THCAS intact and the plot on the right shows a sample likely to have CBDAS deleted.
Nearest Genetic Relatives Dot Plot
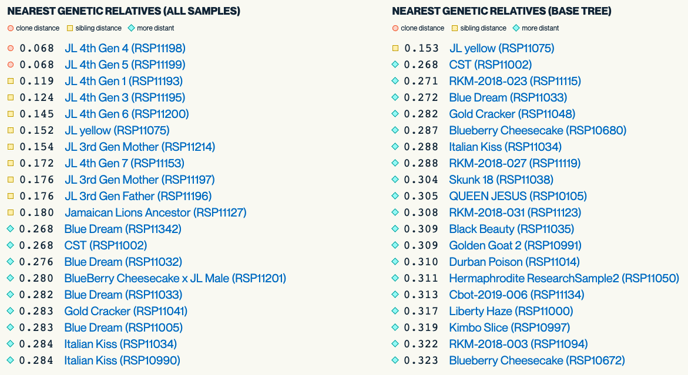
This dot plot which shows the 20 cultivars in our database that are the closest genetics relatives to the submitted strain.
Most Genetically Distant Strain Dot Plot
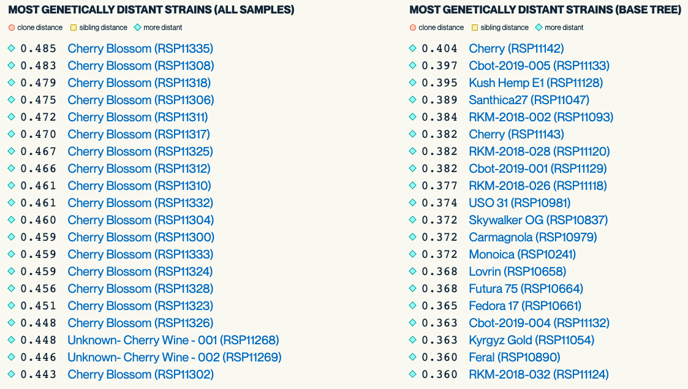
This dot plot which shows the 20 cultivars in our database that are most distant to the test sample.
The closest and most distant samples can be useful information for breeders who are interested in creating new cultivars. It can also be helpful for potentially identifying if lines are clonal or not. Breeding with genetically distant cultivars will produce diverse phenotypes which will likely have high heterozygosity or hybrid vigor.