When analyzing qPCR data, any reaction producing a Cq value should be visually confirmed with the graph. A visual assessment of the amplification plot must be performed to confirm true amplification of the DNA template occurred and verify the plot is not simply background “noise”.
1. Review the raw data for each sample:
After opening your AriaMX data file (.amdx) and selecting the wells of interest, use the plate view of the Raw Data Plots to scroll across the plate to confirm amplification in sample wells and positive control wells. This review also ensures that thermal cycling is uniform across the plate. -png.png?width=460&name=Screen%20Shot%202021-08-24%20at%2012-05-45%20(2)-png.png) Figure 1. Raw data (R) plots for which the cycle quantification (Cq) will be generated.
Figure 1. Raw data (R) plots for which the cycle quantification (Cq) will be generated.
2. Look at the raw data in the "Graphical Displays" view:
For each target make sure the baseline is flat and the fluorescence signal grows rapidly over 5-7 cycles as seen below. (To view the raw data select "R" next to "Fluorescence Term" at the top right-hand side of the screen.)
-png.png?width=500&name=Screen%20Shot%202021-08-23%20at%2010-43-50%20(2)-png.png) Figure 2. Good baseline with sigmoidal shaped curve increase in the internal control fluorescence.
Figure 2. Good baseline with sigmoidal shaped curve increase in the internal control fluorescence.
3. Check the amplification plots for a semi-logarithmic curve with two distinct phases that crosses the threshold:
Select the ∆R Fluorescence Term and look at the shape of the amplification plot. The graph should have the classic semi-logarithmic shape with two visually distinct phases.
- Phase 1 shows exponential growth in the fluorescence, in a span of around 5 cycles.
- Phase 2 is a plateau where the amplification signal growth ends but remains level.
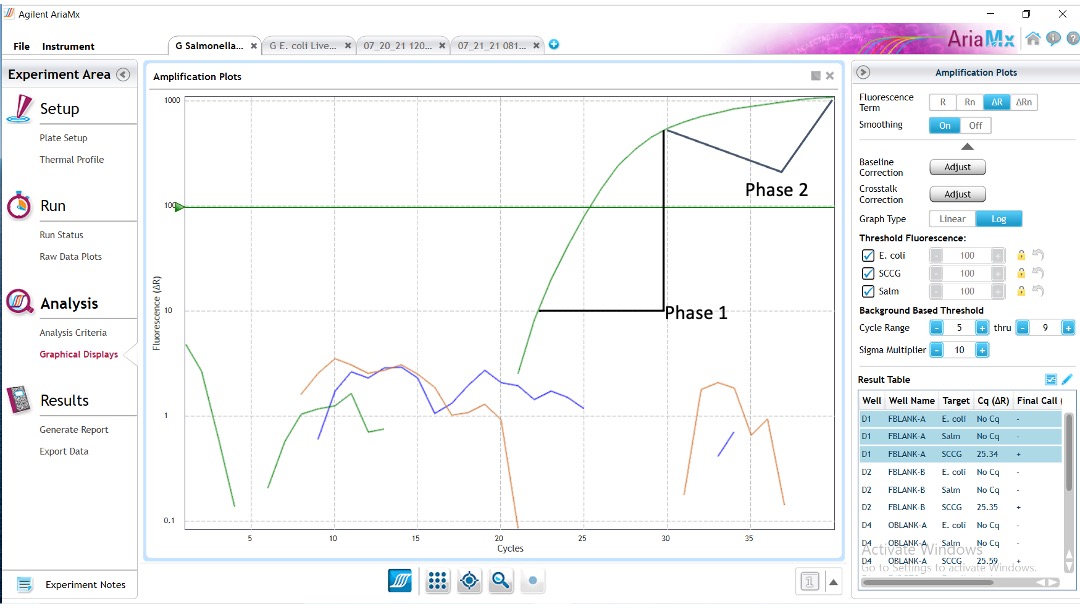
Figure 3. This is an example of a good semi-logarithmic amplification plot. Phase 1 and Phase 2 are indicated in the figure.
When to re-run the sample DNA with dilutions and replicates to confirm positive hits:
An effective next step to confirm true amplification is to re-run the same sample DNA at full strength compared to dilutions of the DNA. We suggest running the original DNA at full strength, a 1:2 dilution, and 1:10 dilution. When Amplification of target DNA is diluted the Cq values should increase in predictable increments (1 Cq for a 1:2 dilution and 3.3 Cq for a 1:10 dilution). If the fluorescence is truly an artifact the Cq will disappear when diluted.