State regulations for total count microbial tests, such as total yeast and mold and total aerobic bacteria count, currently use nomenclature from culture-based methods to set acceptable thresholds or allowable amounts. With this in mind, it was necessary for Medicinal Genomics to convert the quantification cycle (Cq) value from the PathoSEEK® qPCR Detection Assays to colony forming units (CFU), which is reported when using culture-based methods. This allows the accuracy and speed of a qPCR platform to be utilized for tests that require reporting in CFUs.
https://help.medicinalgenomics.com/en/what-are-cq/cfu-conversion-equationsThe method for the generation of Cq to CFU conversion equations is described below. The data generated by qPCR runs are compared with the data generated from culture based methods and plotted on a graph, generating what we refer to below as a “curve”.
Culture Growth
To create a total count curve, we first prepared 10 separate single-organism cultures in 50 mL conical tubes, containing 25 mL of TSB. We selected the 10 organisms from the AOAC’s list of inclusivity organisms. Each culture was incubated for 16 hours.
Preparing Serial Dilution
After incubating the cultures for 16 hours, we performed a serial dilution for each organism following the steps below.
- Six 15 mL conical tubes were prepared with 9 mL of water for each organism.
- Tubes were labeled: 1:10, 1:100, 1:1,000, 1:10,000, 1:100,000, and 1:1,000,000.
- Culture was mixed well by vortexing
- 1 ml of culture was added to the first tube labeled 1:10.
- The 1:10 tube was mixed well by vortexing
- 1 ml of the 1:10 solution was added to the tube labeled 1:100
- The process of vortexing and adding 1 mL of solution to the next tube in the series was continued all the way out to 1:1,000,000.
These diluted organisms were then used to obtain the qPCR and plating data described below.
qPCR Prep for Flower Curve
1 mL of each diluted organism was aliquoted into 3 separate 1.5 mL tubes, creating 27 total samples.
The SenSATIVAx Flower DNA Purification protocol was then performed on each sample followed by the appropriate PathoSEEK qPCR Detection Assay Protocol.
Finally we analyzed the qPCR results and calculated an average of the three replicates, which was used to graph the data compared to the plating results.
Plating
Each diluted organism made above was plated in triplicate (100 uL each).
After incubating for the required amount of time, colonies were counted. If samples were Too Numerous to Count, data was extrapolated from the larger dilutions. . An average was then calculated and used to graph the data compared to the qPCR results.
Graphing Data
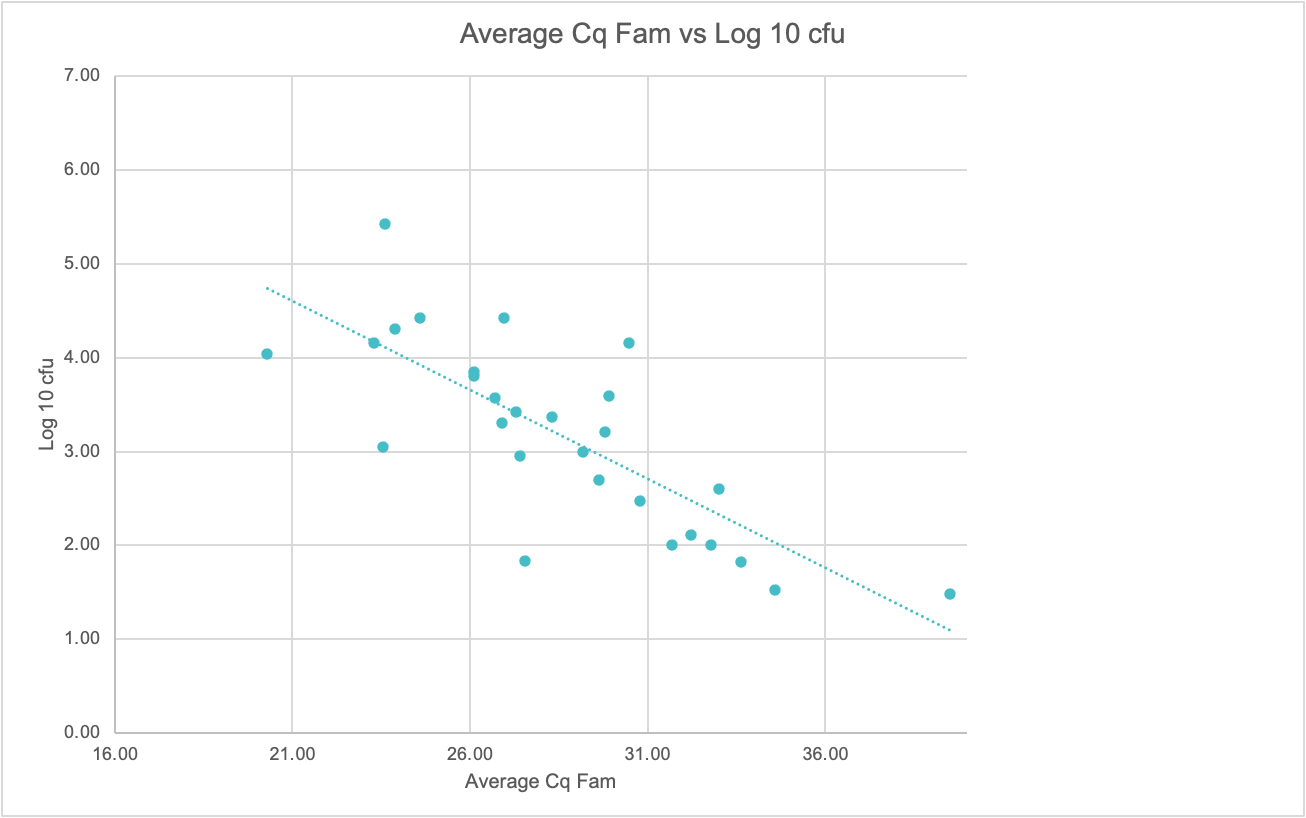
All the average CFU data from plating was converted into log10. The Average Cq data was then placed on the x-axis, and the log10 CFU data was placed on the y-axis of a scatterplot graph, making sure the dilutions match up between plating and qPCR.
A best fit line was applied to the data, which gave a formula of y = mx + b.
Y = log10 cfu
M = slope
X = average Cq
B = y intercept
To solve for y, you need to plug in the data points, and then take the inverse log10 of the sample (10^y).
Summary
These equations were developed for each of our enumeration, or total count, assays and can be found within the user guides and validation documents here:
https://www.medicinalgenomics.com/product-literature/
The Cq to CFU equations developed by Medicinal Genomics Company (MGC) and provided to its partner laboratories, meet all internal specifications and are approved for laboratory use. Any deviations from the User Guide for each product are not supported by MGC.
Results may vary based on laboratory conditions. For example, altitude and humidity are known to affect the growth of bacterial and fungal species. All thresholds and equations were determined based on the results from the BIO-RAD CFX96 Touch™ Real-Time PCR Detection System and verified on Agilent AriaMX Real Time PCR System. When using a different qPCR machine, ramp rates and temperature thresholds can alter the values and thus alter the equation.